How to Compare Simulation Results Across Multiple Design Iterations and Product Versions?
VCollab hotspot analysis can be used to compare results in multiple models.
Merge Two Models
Select File | Open command and load the first model.
Select File | Merge to load another model for comparing.
Both models will be displayed.
Arrange models as required using model transform options in the product tree.
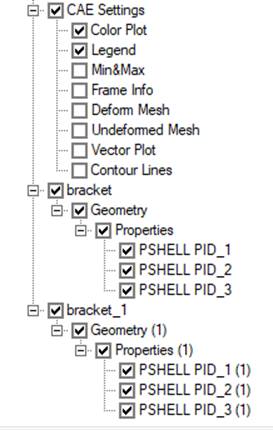
Merged models in product explorer
The Product Explorer will show two models.
Each model will have associated parts. Users can select and display only required parts/models.
When parts have the same name, the names are displayed with additional id (such as “ Object (1)”).
Select and display Result
Select CAE | Result List.. from menu bar or click icon
 from the toolbar to open
CAE results dialog.
from the toolbar to open
CAE results dialog.Model: Select active model. Note that the active model is used as a reference model and is compared with all other models.
Palette Options: When more than one models are present, it is possible to use one or more palettes.
Multiple Palette option: Each model will have one palette. Users may have to arrange the palette/legend display as required. In this option it is possible to select different results for different models.
Combined Palette option: In this case one palette is displayed based on the same result across all models. This option is useful for comparing multiple parts with a single palette.
Multiple - Common: In this case one palette is displayed based on results (different results) across all models. This option is useful for comparing multiple parts with a common palette.
Active Model option: In this case, only active models will be displayed with CAE results. All other models will be displayed in part color. It is possible to hide all other models using the Hide Other Models option. The current model will be displayed based on current model palette settings.
Results: Select a result for analysis.
Comparing different results contour of similar models
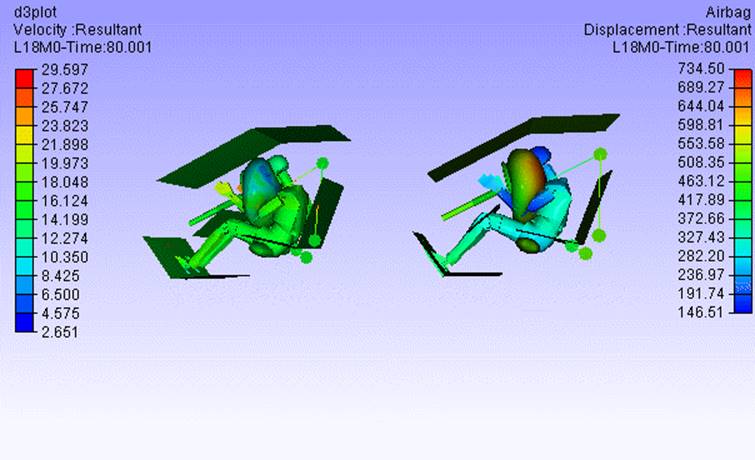
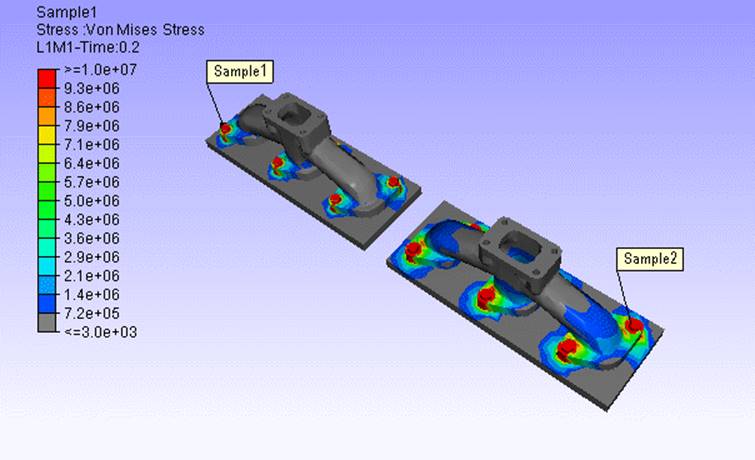
Multiple Palette can be used to find the range of result values in each model. In the following image two models are merged. Both models have different results.
Multiple: Common Legend option can be used to set a single legend range of the current model and apply the same to all merged models. Users can compare the results through contour difference between models.
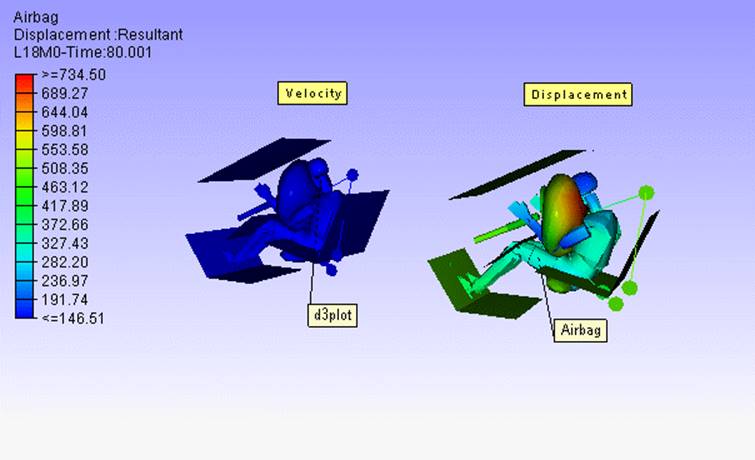
Comparing same result contour of similar models
Combined option helps users to compare the same result instance in different models. It sets a single legend from the same result range across all models. Users can compare the results values through model contour (color plot).
Comparing Strain Energy in Multiple palette |
Comparing Strain Energy in Combined palette |
|
|
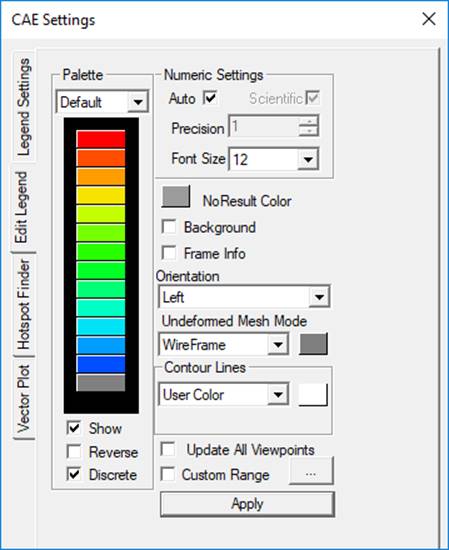
Legend Settings to display Hotspots
The CAE color plot display will be based on the CAE Legend settings. Modify CAE legend settings to highlight the hotspots. In the default settings the range of values associated with the legend colors are computed based on minimum and maximum values of selected result for the displayed model. To highlight the hotspots it may be required to modify this range such that the color associated with the values of interest is displayed in a prominent color such as red.
Set Min and Max Range Values such that required values are displayed in Red.
If required modify colors using CAE Setting | Edit Legend tab
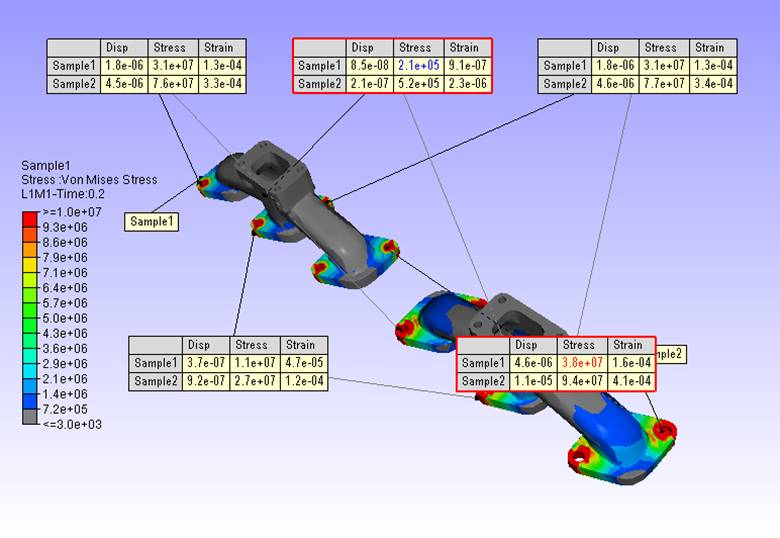
Display hotspots in both models
Use Hotspot Finder option in the CAE settings dialog to mark hotspots with labels.
Display only required parts using the Product Explorer.
Select Hotspot Finder tab and set appropriate filters.
Select All-Results Table (required for multi-models) as probe type.
Use Probe Label Settings to set required results
Use Compare Options to set compare option off (to display hotspots independently in two models)
Arrange Labels as required.
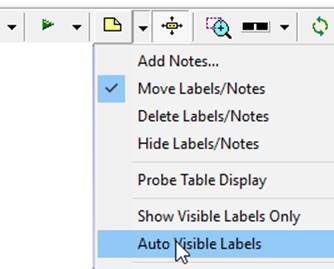
Set Auto Visible Labels option to view visible hotspots.
Note that only required parts are displayed. Hotspots with Min/Max values in each model are highlighted.
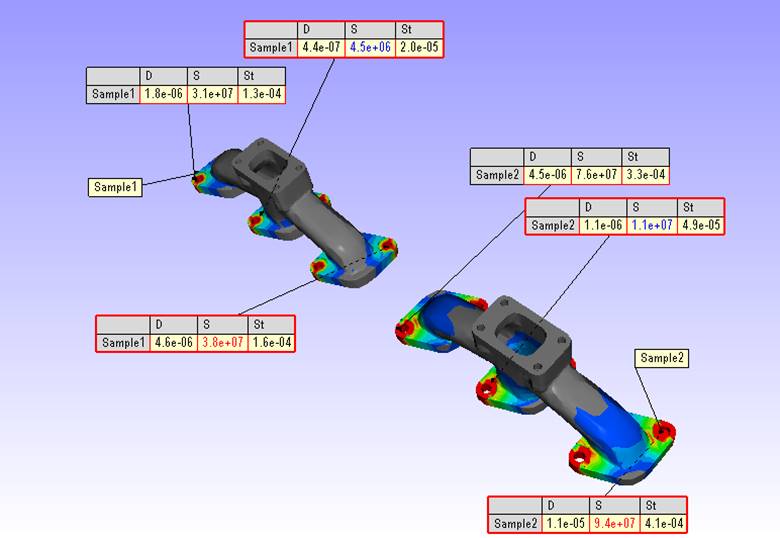
Display Compare Hotspot Labels
Compare option can be used to compare two models. In this option hotspots (results) from the active model are compared with results in the other model at nearby location or nearby hotspots. VCollab has many options to select a node in the other model for comparison.
Use Compare Options in hotspot settings dialog to set required options / methods.
Click Find Hotspots to generate compared hotspot labels with two connections.