How to Visualize CAE Results Contour?
CAE Results contour can be visualized using the Result List option in VCollab Pro.
Load a CAX file.
Click ‘CAE | Result List…’ menu item
Or
Click the result list icon
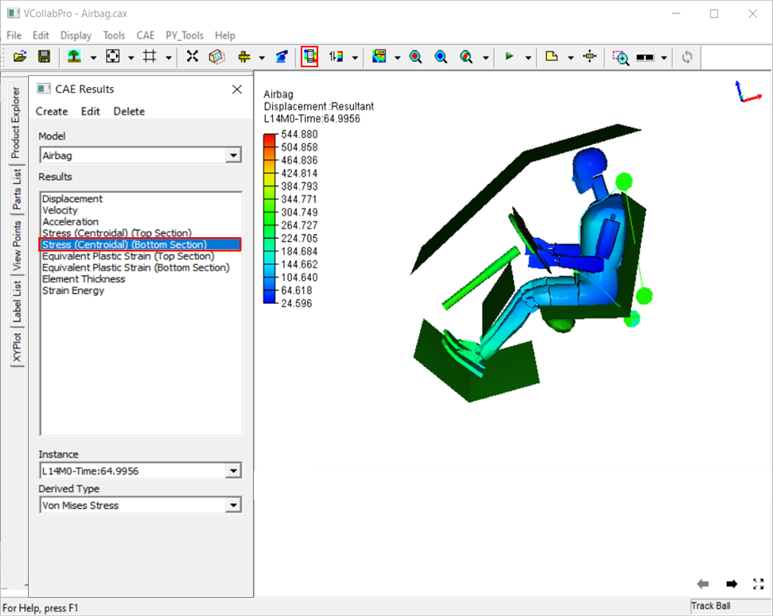
 to open the CAE Results dialog,
Select a Result, e.g.,Stress (Centroidal)
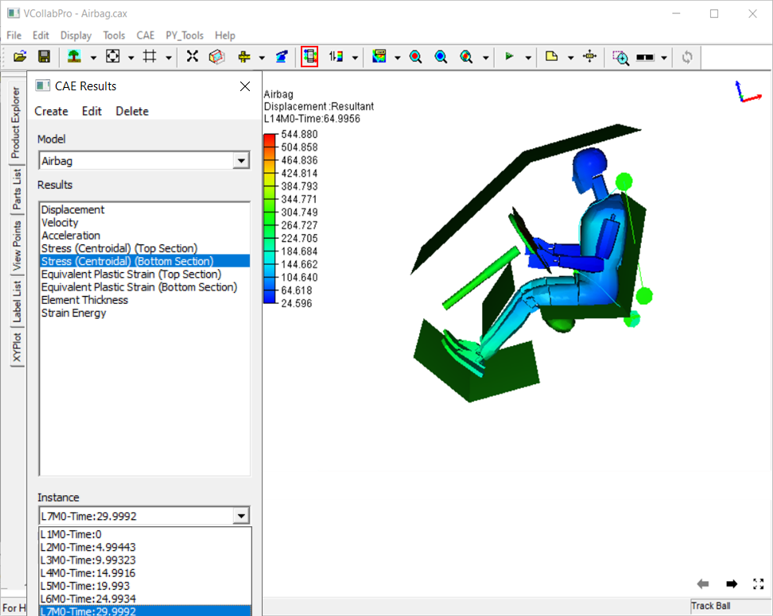
Select an Instance, e.g., ‘L7M0’.
Select a Derived Type, e.g.,Max. Principle Value.
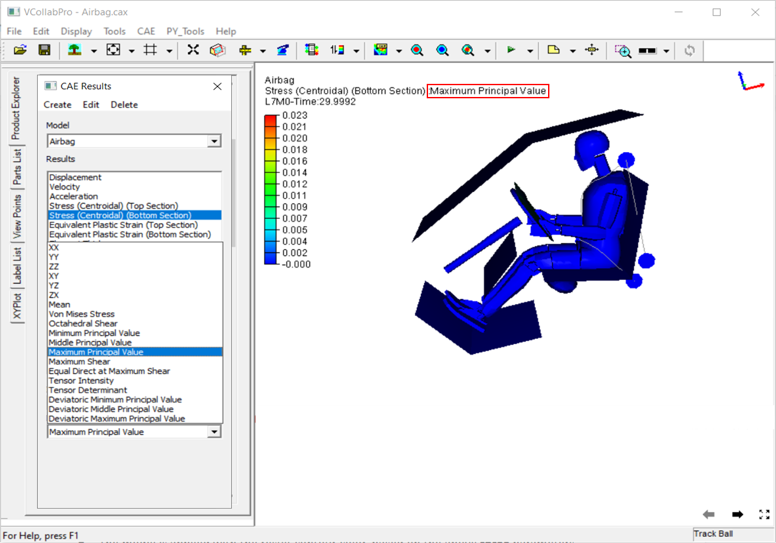
The model is applied with the result contour color, based on the above three parameters.
Contour will change if the above parameters change.