How to Select and View CAE Results?
To be able to view CAE results, following pre-conditions are essential
CAX file should be loaded with CAE results data.
Model can be displayed in Material color or CAE Result contour/color.
Make sure that Color Plot and Legend options are enabled. These options can be enabled in Product Tree or in CAE Settings dialog.
Result Visualization
Results can be viewed either for specific node IDs or for entire model.
Results applied to the entire model.
Results for particular node IDs
Complete simulation of a CAE result.
Color Plot Visualization
How to Select CAE Result for Color Plot?
Click ‘CAE | Result List…’ or click the result list icon
![]() to open the CAE Results dialog
to open the CAE Results dialog
Select a model if more than one model is merged
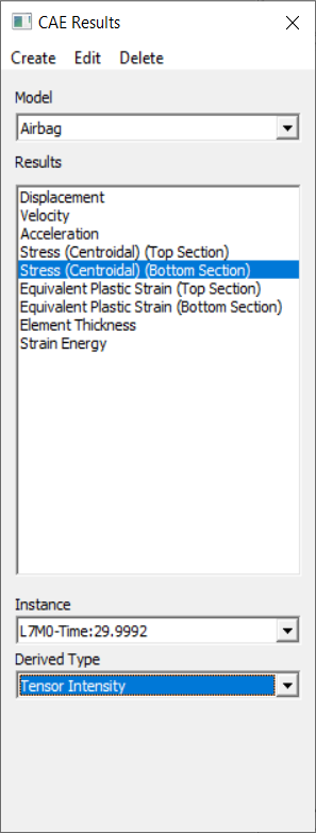
Select a CAE result from the list box. A CAE result consists of several instances.
Select an instance from the Instance dropdown list. The first instance will be selected by default.
The instance result contains all component values per node.
Select a component or derived scalar type from the Derived Type dropdown list.
The selected scalar derived result is applied to the model as contour or color.
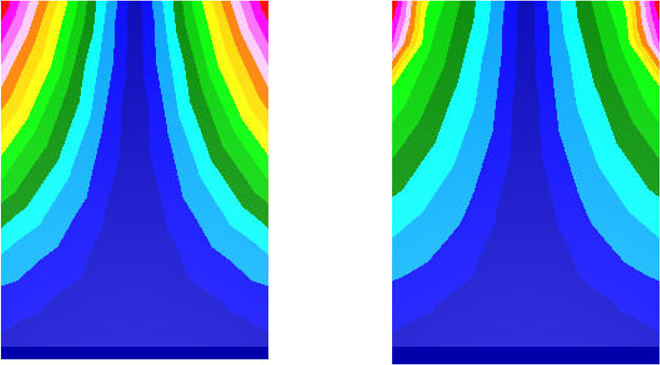
How to visualize specific result contour range or zones?
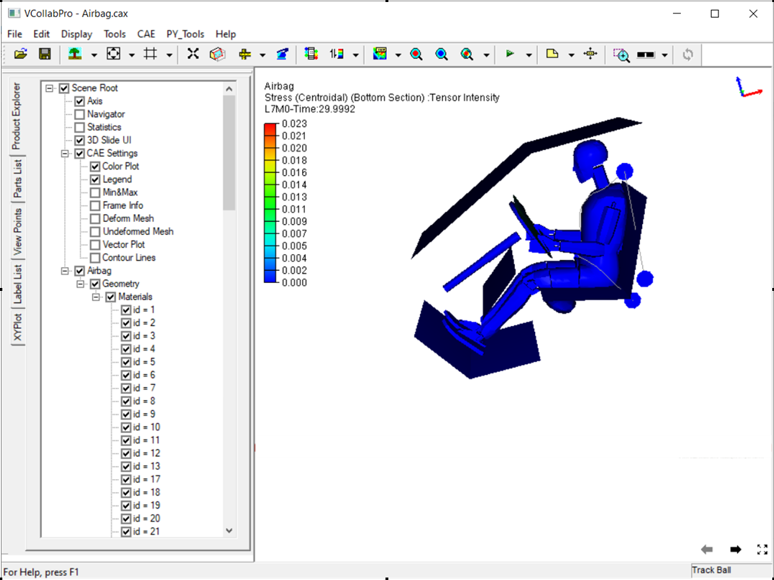
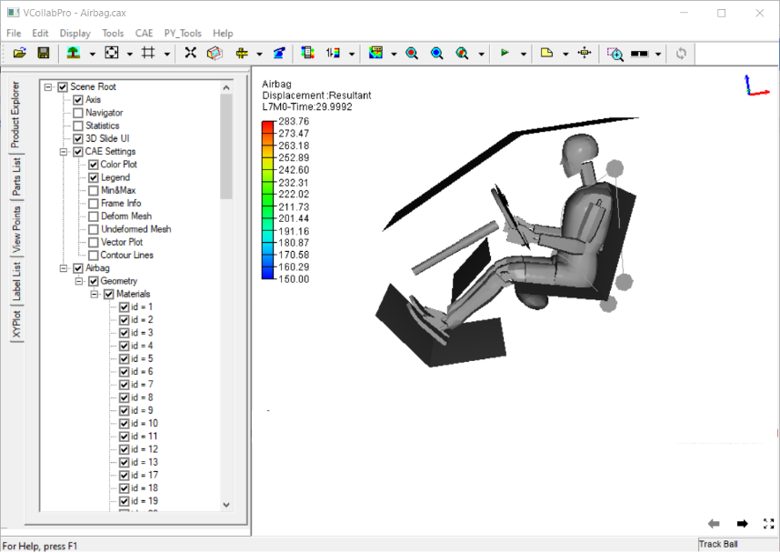
Load Airbag.cax from the sample folder.
Select Displacement result with default derived type.
Select the last instance or frame.
To customize contour, click CAE | Contour Settings.
Go to the Legend Settings tab.
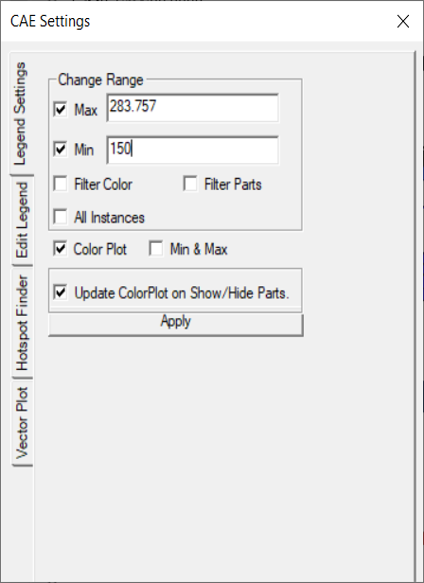
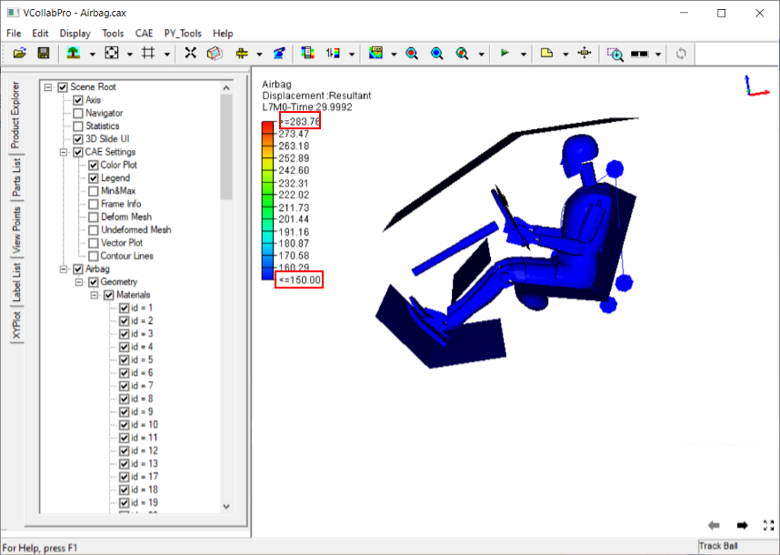
To visualize the result range between 150 to 283 units, set min and max fields with 150 and 283 respectively.
Click Apply
To filter the contour color beyond user range, click Filter and Apply.
To hide the parts beyond range, click Filter Parts and Apply.
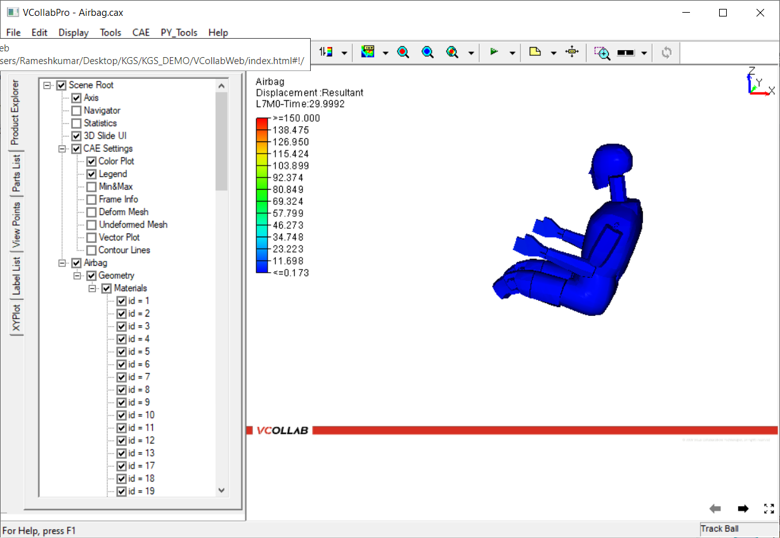
The result zone can be visualized clearly with the above options.
What is the custom range and how to use it?
Legend palette values are divided evenly by ‘n’ number of colors. Here the length of any two consecutive ranges is constant and interpolated linearly.
Custom range allows users to define any length for any range but with following limitations.
Length of any range should be less than length of min and max.
Users are not allowed to edit extreme values. But it is possible in
User modified values should be between predecessor and successor values.
If there are blank in the palette values, it will be interpolated linearly by default.
Steps for Custom Range usage:
Click the Custom Range option to enable.
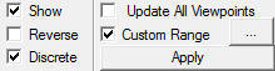
Click the button next to the Custom Range option to open the Custom Range panel as shown below
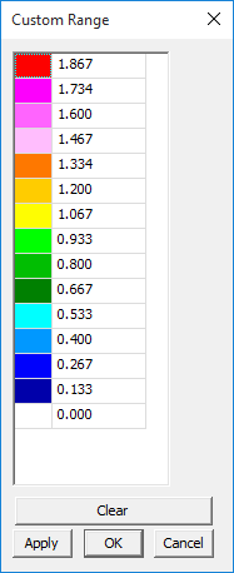
Change any value out of extremum values.
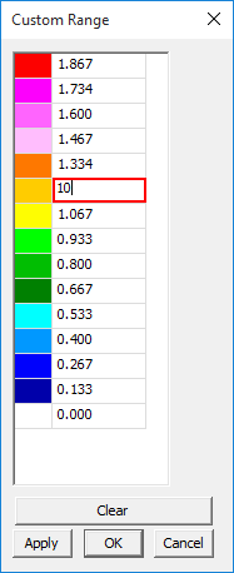
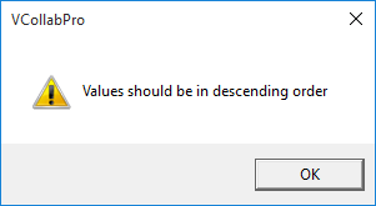
Click Apply.
A warning message - ‘Values should be in descending order’ is displayed
Change some values and leave some blanks in the palette.
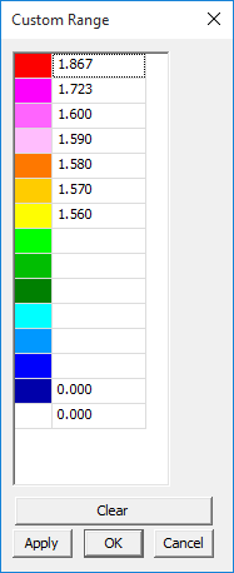
Click Apply and notice that blanks are filled by interpolation.
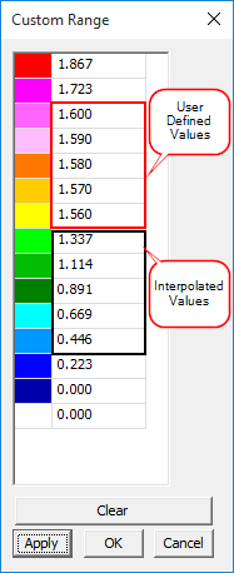
Click Apply.
Notice the changes in the color plot of the model according to the new custom range palette.
How to edit legend Palette?
Users can edit the number of colors and individual colors from the palette dropdown list.
VCollab Provides between 2 to 32 size.
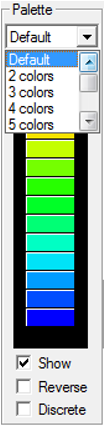
This dropdown list includes some predefined set of colors used in different CAE software tools.
Predefined color sets are,
Default (VCollab),
Predefine#1
Predefine#2
Predefine#3
Predefine#4
To edit an individual color, click the color in the palette which opens the color selection dialog.
Select a color and click OK.
Click Apply to apply the modification to the scene.