CAE Settings
VCollab Pro users can edit range, colors, format of legend values, etc. using options available in CAE Settings. The modifications are grouped into four tabs as below.
Legend Settings
Edit Legend
Hotspot Finder
Vector Plot
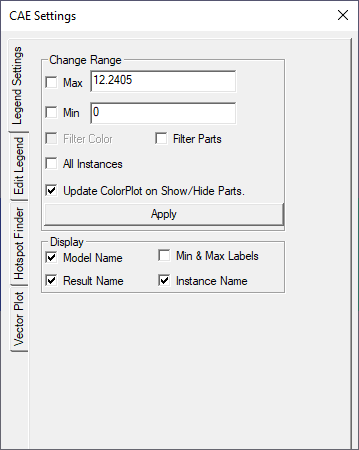
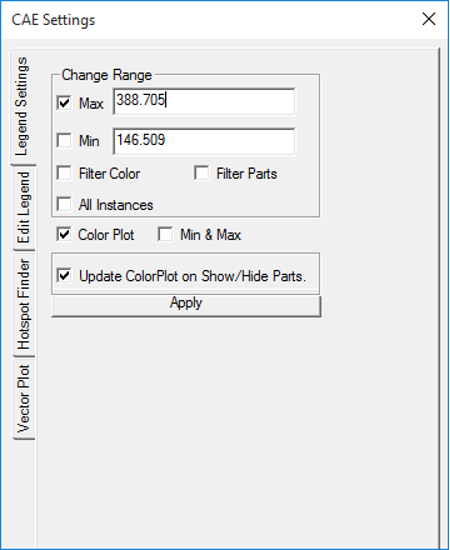
Legend Settings
The various fields available in the Legend Settings tab are explained below.
Change Range
Change min & max values.
Min
Modify min value in the range.
Max
Modify max value in the range.
Filter
Applies palette colors only for values within the min max range. Out of bound values are applied with filter color
Filter Parts
If enabled, Parts beyond result range will be hidden
All Instances
Applies the modification to all instances
Color Plot
Applies/Removes color plot. The model will be seen in material color if this option is off.
Min & Max Labels
Displays Min and Max value labels attached to corresponding nodes.
Update Color Plot on Show/Hide Parts
Updates color palette and its values while hiding / showing parts.
Header Display
Show / Hides Legend Headers, Model Name, Result Name and Instance Name
Apply
Applies the modifications.
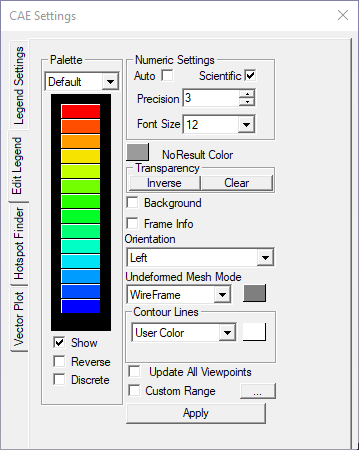
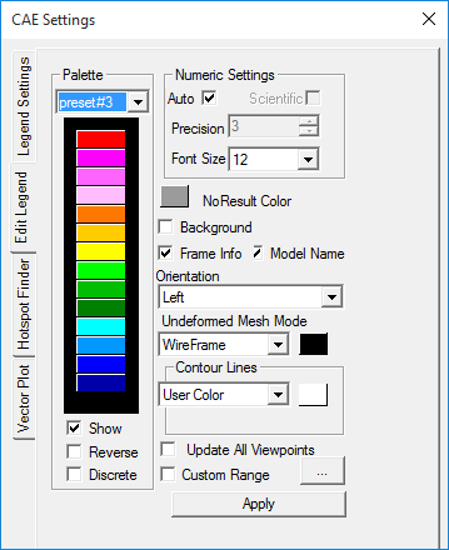
Edit Legend
The various fields and options available under Edit Legend tab are explained below.
Palette
Choose the colors to be applied on the model.
Auto
Allows the application to compute text format precision and scientific values. Precision and scientific options are disabled when 'Auto' option is enabled.
Scientific
Allows user to display in scientific or standard format.
Precision
Select the decimal places for contour values
Font Size
Change the font size.
No Result Color
Select a color to denote no result data. Default color is grey.
Transparency
Allows user to invert the transparency and to clear the transparency.
Background
Enable and set background color.
Frame Info
Display/Hide frame information
Orientation
Choose the orientation of the legend - left, right, top or bottom of the view port.
Undeformed Mesh Mode
Change Undeformed Mesh Mode and its color.
Contour Lines
Select contour lines color.
Show
Show/Hide Legend palette.
Reverse
Reverse the legend values against the color palette.
Discrete
Switch to discrete fringe bands in color plot.
Update All Viewpoints
Update the changes to all available viewpoints.
Custom Range
Switch to customized range palette and color plot.
Apply
Apply the changes to the viewer.
Note
Double Clicking on the legend color palette (including No Result color box) inside the viewer opens up CAE Settings Dialog with Edit Legend page.
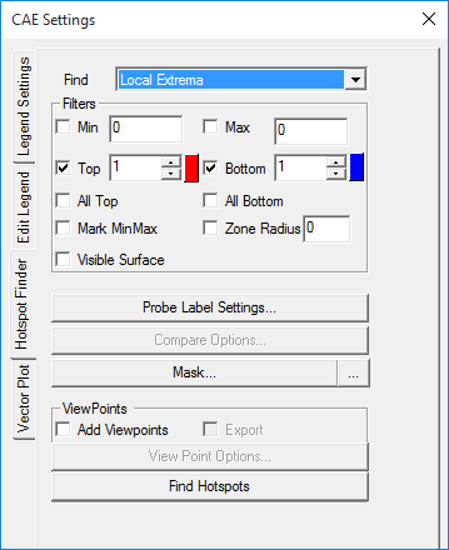
Hotspot Finder
The Hotspot Finder can find in,
Local Extrema - To find regional or local min and max values.
Global Extrema - To find the minimum and maximum values in the selected region not like local extreme values.
Range Cluster - To finds hotspots one per palette range.
The various options and fields seen in Hotspot Finder tab are explained below.
Find
Select a mechanism either Local extrema or Global extrema
Min
Set minimum range.
Max
Set maximum range.
Top
Specify the top count. If 5 is specified, the top 5 values will be given
Bottom
Specify the bottom count. If 5 is specified, the bottom 5 values will be given
All Top
Includes all same top values and its IDs.
All Bottom
Includes all same bottom values and its IDs.
Mark MinMax
Highlight the labels of maximum of top labels and minimum of bottom labels
Zone Radius
Skip an area around already found hotspots.
Visible Surfaces
Consider visible labels only.
Probe Type
Based on this, displays value for current result or all results in a table, or all instances in table or XYPlot.
Template Type
Provides a list of predefined label formats.
Result Options
Allows users to customize the list and order of results in the labels.
ID
Includes or excludes node or element ID in the label
Compare Options
This option is visible if at least one file is merged with the existing one. It will open a dialog box with compare options.
Add Viewpoints
Generates viewpoints according to viewpoint options if enabled.
Export
Exports the viewpoints into either VPT file or microsoft PPT file
View Point Options
Provides various options to include or exclude different types of viewpoints
Find Hotspots
Generates viewpoints for the model according to above information
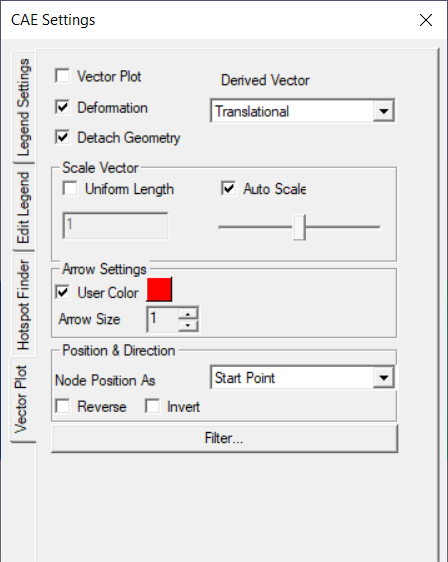
Vector Plot
The various fields seen in the Vector plot settings panel are explained below
Vector Plot
On/Off switch to plot vectors.
Derived Vector
Default derived vector for vector result is Translational and for scalar and tensor is Normals.
Deformation
Sets deformed nodal position as the starting point of the vector.
Detach Geometry
Displays vector plot of a part, even if the geometry is hidden.
Uniform Length
Enables Fixed length to all the vectors. User can enter the fixed value.
Auto Scale
Enables Auto Scale for vector plot
Scale Slider Control
Scale up or scale down. Slider will be enabled when either Auto scale is unchecked or Uniform Length is checked.
User Color
Select a color from the palette for vectors.
Arrow Size
Choose any one size out of three for the arrow.
Node Position As
Set nodal position as either start point or end point.
Reverse
Change the direction of vector.
Invert
Inverts the Vector Plot Display.
Filter...
Allows users to filter the nodes using zone radius and nodesets.
The derived vectors are based on the type of result selected.
Result type
Available Derived Vectors
Scalar
Normals (Nodal or Elemental)
Vector
Translational (Default)
Six DOF
Translational (Default)
Rotational
Both
Tensor
Normals (Default)
Minimum Principal Direction
Middle Principal Direction
Maximum Principal Direction
Full Tensor
Vector Plot Filter Panel
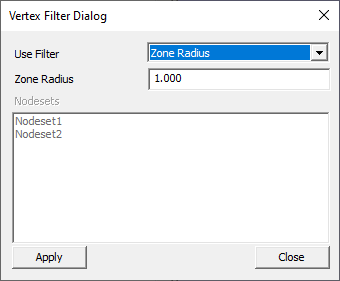
User Filter
Lists the availabel Filter Options.
Zone Radius
Allows users to define a zone radius. Only one vector is considered for displaying vector.
Nodesets
Allows user to select user defined nodesets for displaying vectors. User can select multiple nodesets.
Apply
Applies filtered nodes for vector plot.
Close
Closes the dialog.
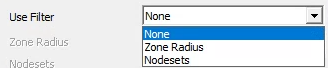
None
No filtering. All the vectors will be displayed.
Zone Radius
Vectors are filtered and there will be only one vector is considered for displaying in the zone of given radius.
Nodesets
Vectors at the nodes of selected nodesets will be displayed.
Steps to update Legend with user defined range
Open the Legend Setting tab by clicking CAE | CAE Settings.
Click Min and Max options to change range.
Enter the new range values.
Click Filter to enable the color window box.
Select a color to be applied for results which are beyond the user range.
Click Update Current Instance button.
Observe the changes in the viewer.
Steps to Edit Legend
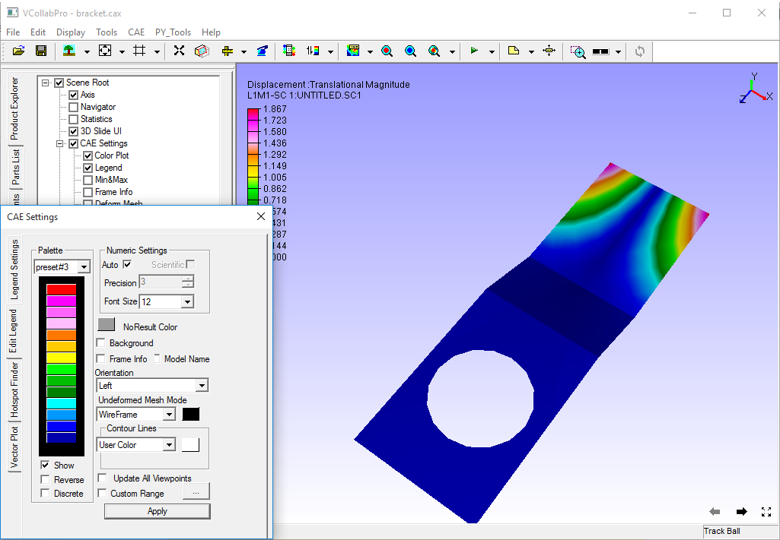
Open Edit Legend tab from CAE | CAE Settings
Select "preset#3" in palette dropdown.
Click Apply and observe the changes in the viewer as below.
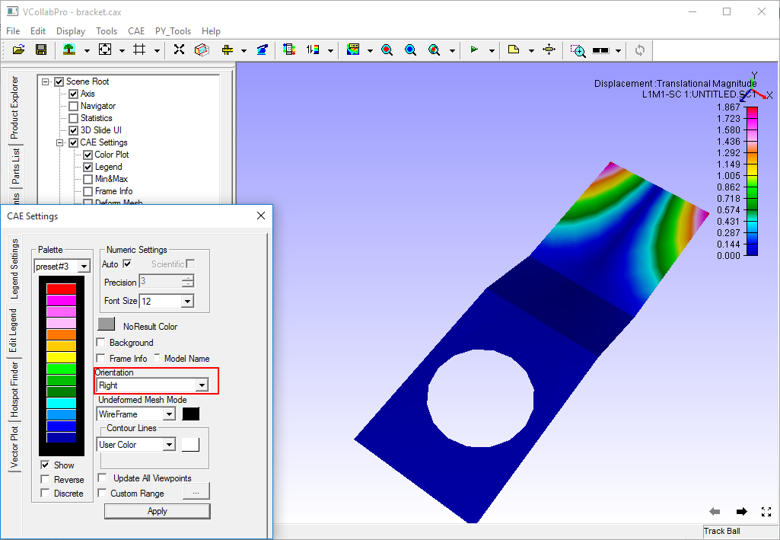
Select an option, say Right, under placement drop down.
The legend and frame information is placed on the right side in the viewport.
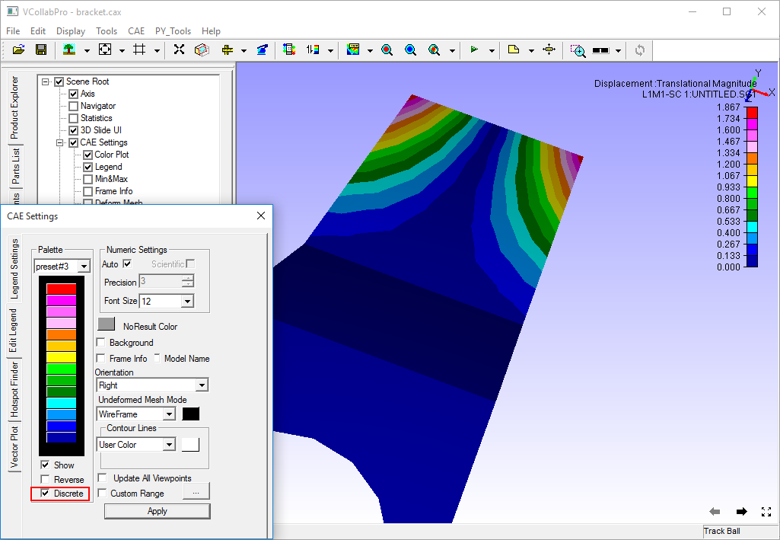
Check Discrete option and click apply.
Palette is changed to discrete color from continuous color.
Contour plot in the model changes according to the modification in color palette.
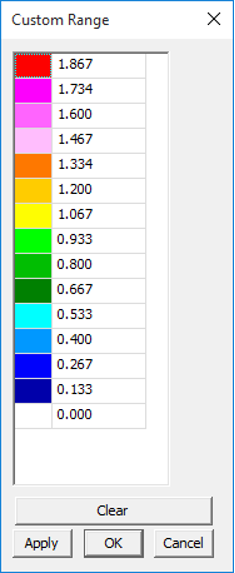
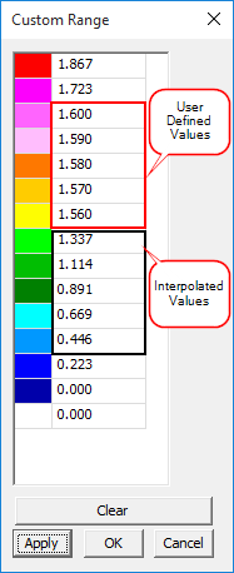
Custom Range
Legend palette values are divided evenly by ‘n’ number of colors. Here the length of any two consecutive ranges is constant and interpolated linearly. Custom range allows users to define any length for any range but with certain limitations.
Length of a range should be less than length of min and max.
Users cannot edit extreme values. But it is possible in Legend settings.
The modified value should be between predecessor and successor values.
If there are blank in the palette values, it will be interpolated linearly by default.
Steps to set Custom Range
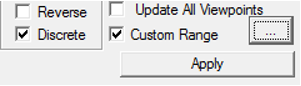
In the Edit Legend tab, check the Custom Range option and click on the button next to it.
The Custom Range dialog box opens up
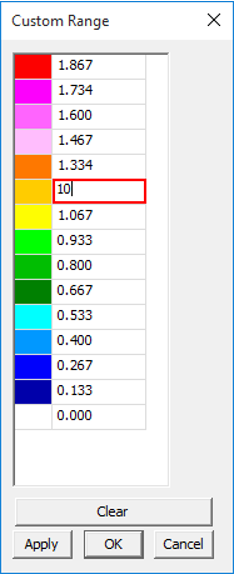
Change any value out of extremum values.
Click Apply.
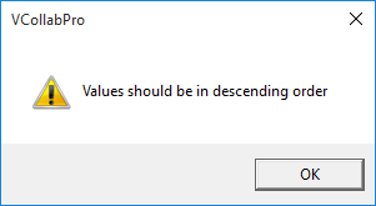
A warning message saying that values should be in descending order is displayed
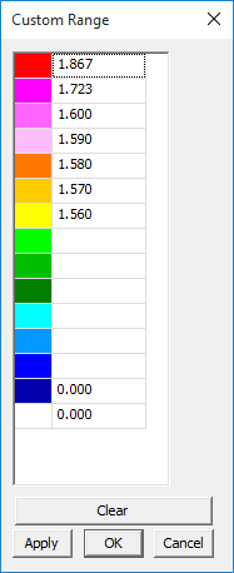
Change some values and leave some blanks in the palette.
Click Apply and notice that blanks are filled by interpolation.
Click OK
Click Apply.
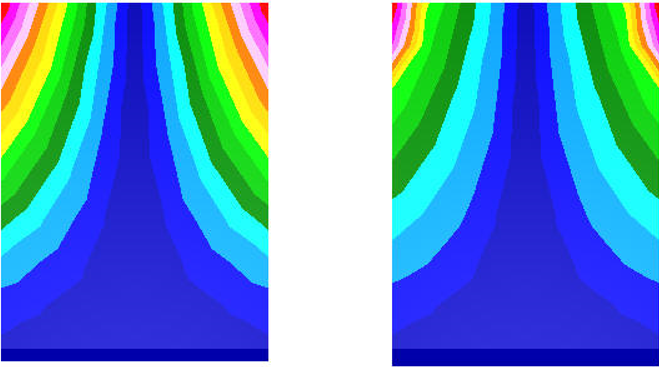
Notice the changes in the color plot of the model according to the new custom range palette.
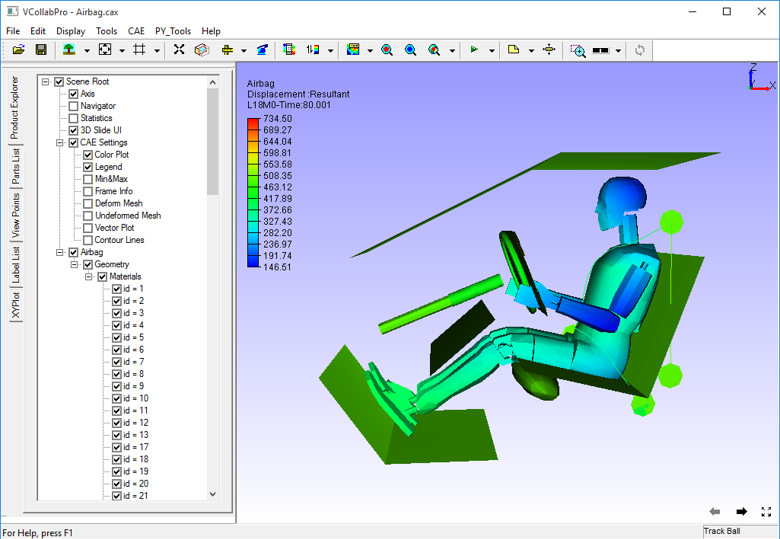
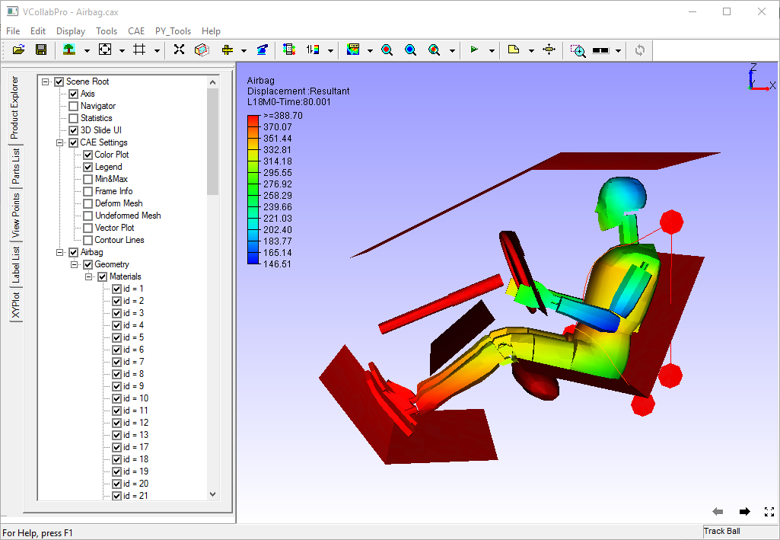
Steps to visualize specific result contour range or zones
Load Airbag.cax from the sample folder.
Select Displacement result with default derived type.
Select the last instance or frame.
To customize contour, click CAE | Contour Settings and open Legend Settings tab.
To visualize the result range between 150 to 300 unit, set the min and max fields with 150 and 300 respectively.
Click Apply
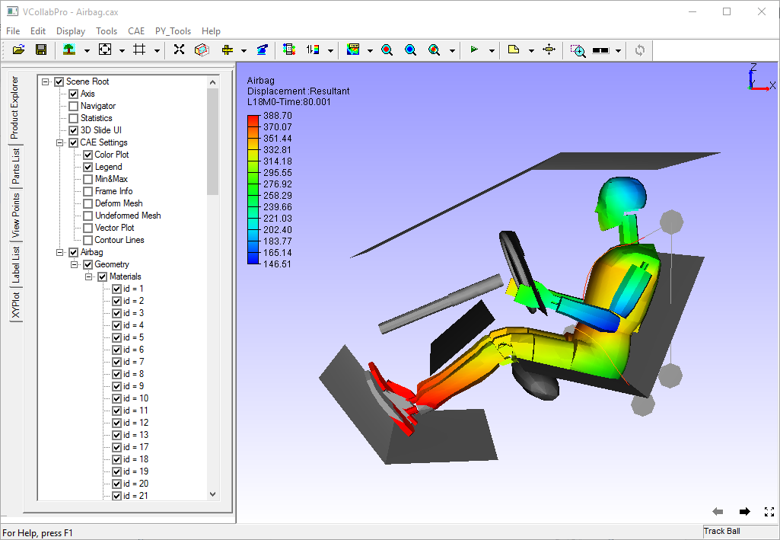
To filter the contour color beyond user range, check the Filter option and click Apply.
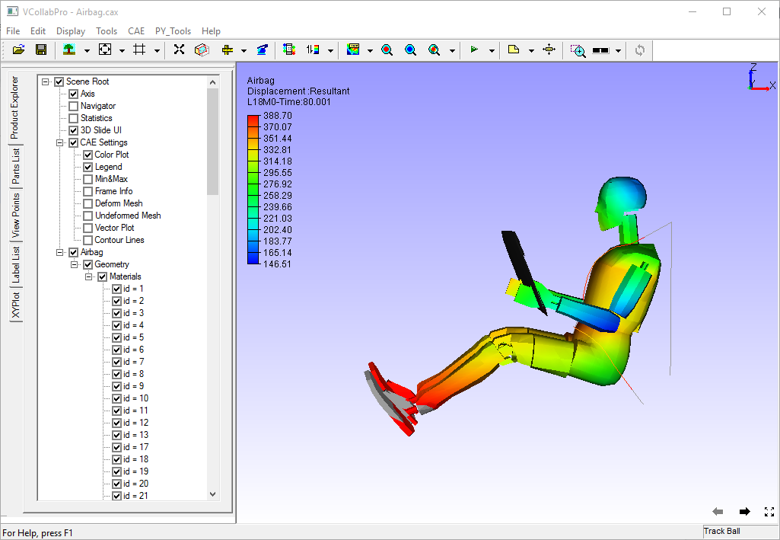
To hide the parts beyond range, check Filter Parts and click Apply.
Users can visualize the interested result zone clearly with the above options.
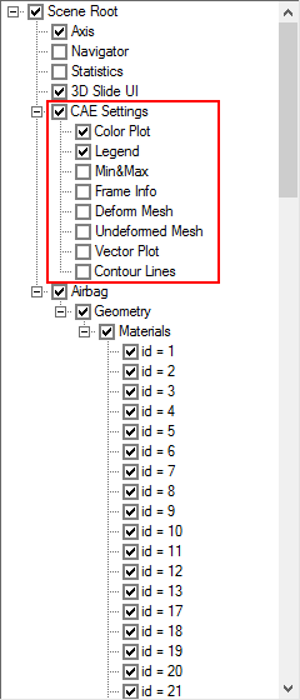
Switching CAE Properties On/Off
VCollab Pro allows users to switch on/off the following CAE properties through product explorer.
Color Plot
Legend
Min & Max
Frame Info
Deform Mesh
Undeformed Mesh
Vector Plot and
Contour Lines