How to Visualise Vector Plot in VCollab Presenter?
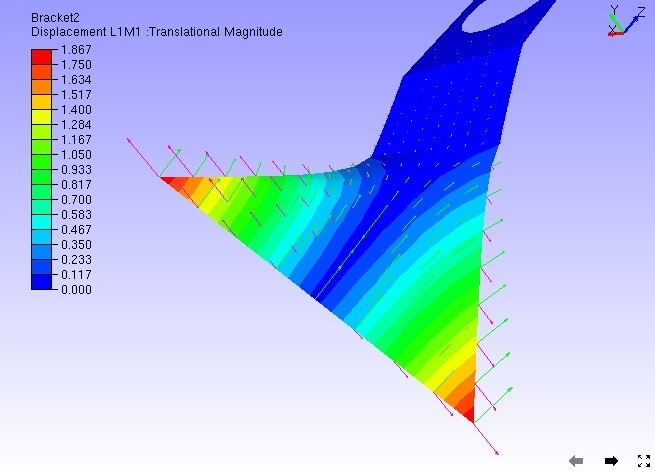
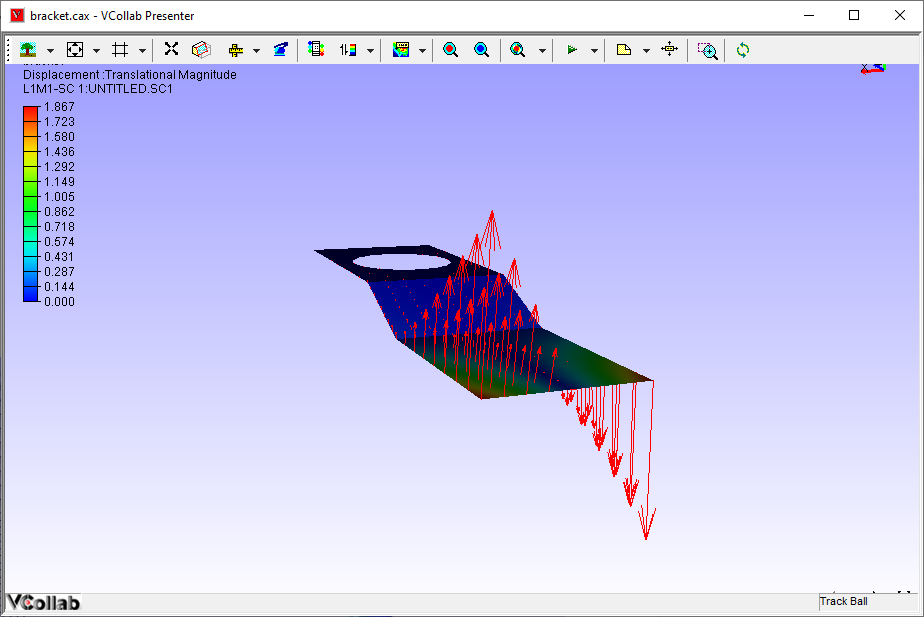
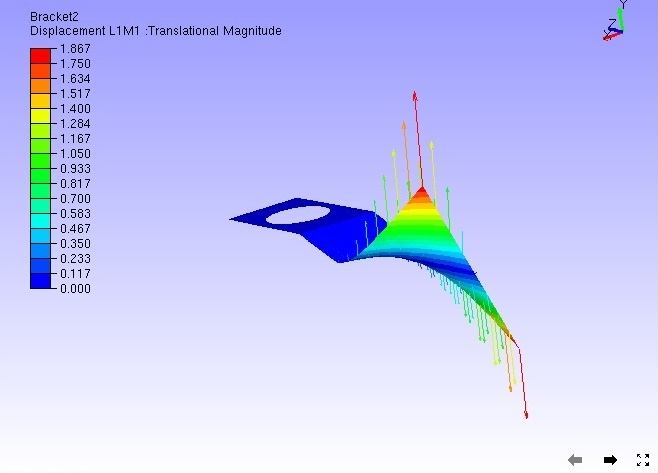
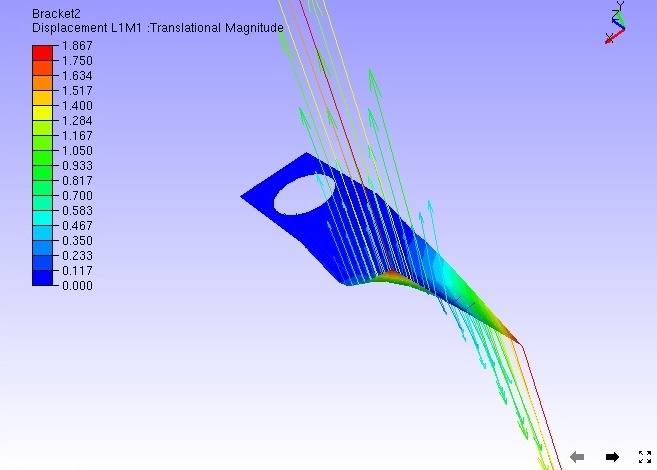
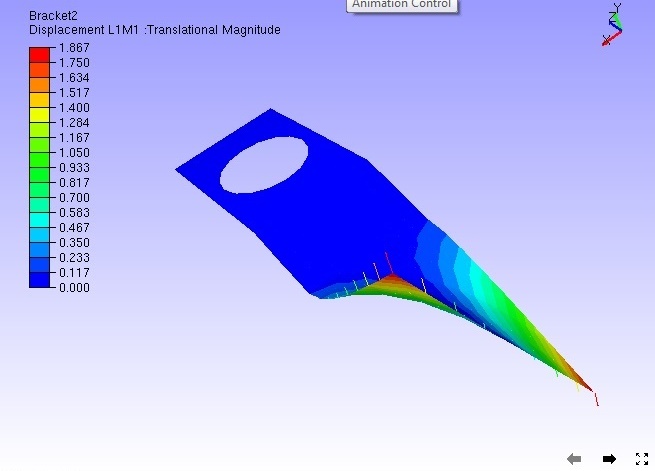
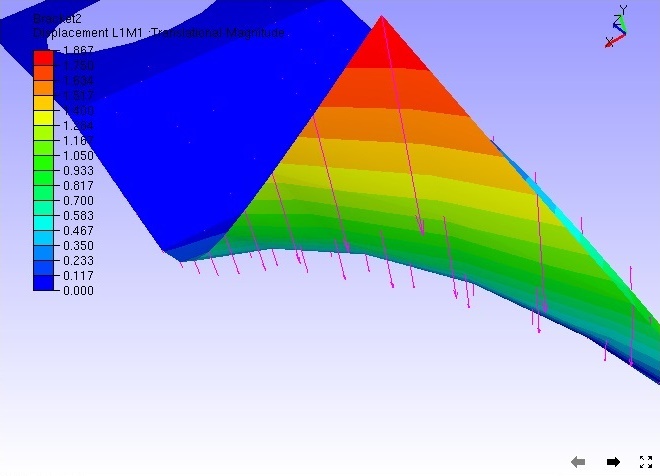
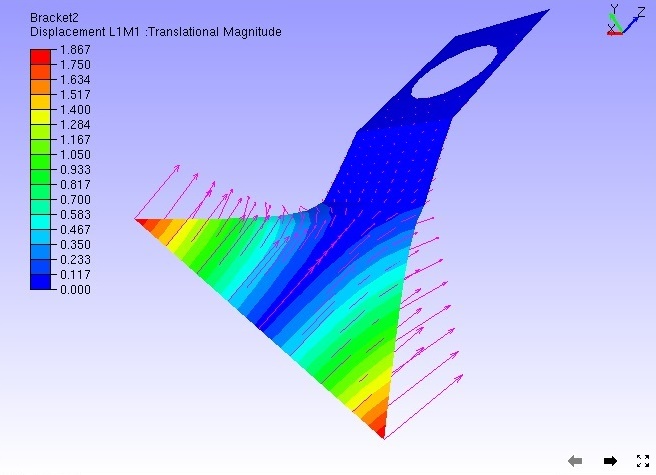
The Vector Plot display option plots vectors for CAE vector type results.
VCollab saves one user color for vector plot in view point as well as in CAX. Full tensor derived type may require 3 user colors at most.
Steps to view and set up Vector Plot
Click CAE | Display | Vector Plot
Or
Click CAE Settings | Vector Plot.
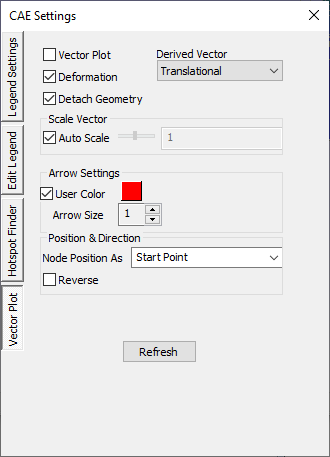
Auto scale helps users to view very huge vectors as well as very small ignorable changes inside the viewer.
Click CAE | CAE Settings| Vector Plot to modify vector plot setup.
By default, Auto Scale is enabled.
Uncheck Auto Scale to scale manually using slider control.
Click the Deformation option to plot the vector with instance and motion of model.
Slider bar is always positioned at the center of the slider unless the user moves.
To scale up, move the slider right side. Slider bar comes to the center once the user releases the mouse button.
To scale down, move the slider to the left.
Users have no constraints to scale up or down. They can enter an exact scale value in the edit box at the end of the slider and apply the same.
Use the Arrow Size option to increase the size of the arrow.
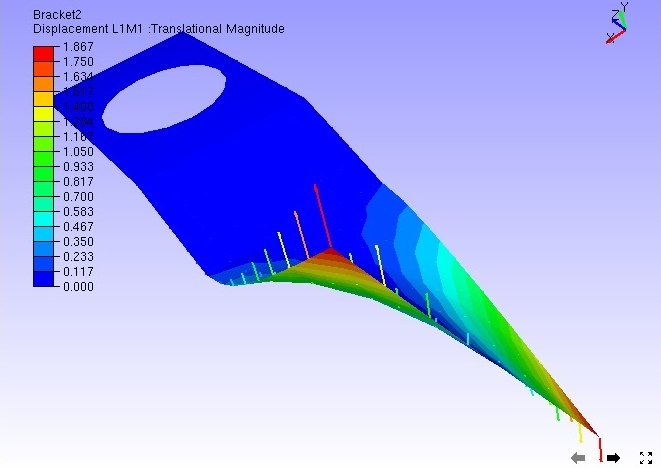
Click User Color to enable the color box
Click the color box with default white color to open up the color palette.
Choose a color and click Ok to apply the color on to the vector plot.

By default vectors are starting from nodal positions. If necessary, make the vectors end at nodal positions by selecting Nodal Position As option as End point.
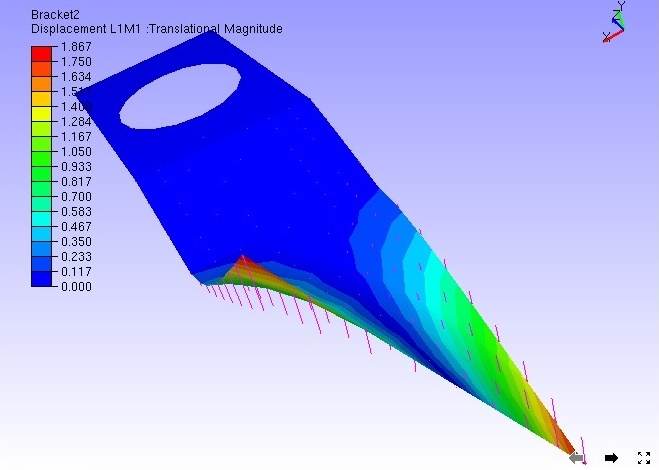
Check Reverse option to reverse the direction of vectors if necessary.
Select Rotational option in the derived vector type
Select Both option in derived vector type which shows rotational as well as translational.